How can you save millions annually on your data center selection.
In a data center, typically 20-40 % of the operating cost is related to data center power costs. The Nordics, and Norway in particular, have considerably lower power prices compared to the rest of Europe. Nevertheless, the largest hubs for data centers in Europe are found in the abbreviation FLAP-D (Frankfurt, London, Amsterdam, Paris and Dublin). The establishment of these hubs have mainly been driven by interconnectivity rather than cost. These cities are the most connected hubs in Europe and will continue to be so. No doubt, interconnectivity is important, but the connectivity landscape is now changing. More and more areas across Europe are increasingly connected and can provide competitive pricing on power as well. In this article I will shed some light on the current data center power costs situation in Europe and how much you can save by choosing your location wisely.
Norway offer Europe’s lowest data center power costs
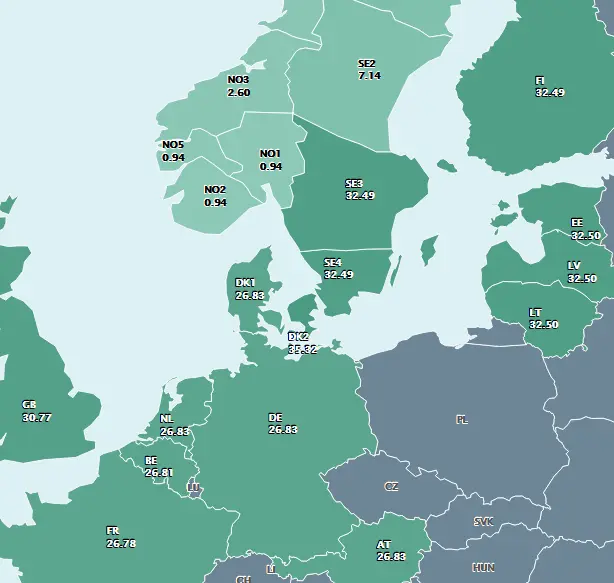
Let’s start with a snapshot of today’s situation. The picture below is taken from Nord Pool which runs the leading power market in Europe – and shows the market differences on the 27th of June this year. The price differences are significant. Of course, the spot power prices vary, but when looking at last years average the changes are still massive. These power price differences will have a strong impact on your operational cost and your overall business case.
Of course, sometimes you do not have the luxury of choosing your data center location freely. Many factors may influence the choice. However, based on my experience, I argue that many site selection decisions are based on ease and convenience rather than costs. No one ever got fired for choosing to locate a European DC in FLAP-D. It is a safe and well-proven choice. But what if costs were given more emphasis in the discussion? I am convinced that many would think differently.
How do you calculate and compare the cost of power between the countries?
Data center power costs are influence by many factors. In general, figuring out the pricing is complex, but typically is a mix of the following components (not a comprehensive list):
- Supply and demand
- Cost of power generation
- Investment in infrastructure and networks
- Distribution quality
- Government regulation, subsidies, and taxes
- Regulation
- Weather
- Profit regime of the utility
- Other external factors (economy, importer/exporter, phase balancing, pricing mechanisms etc)
I often feel frustrated when trying to find the correct power prices myself. There is no exact and reliable overview of the power cost in Europe that take all the same components into account. Some overviews and pricing calculators use outdated numbers. Others are less transparent on what is behind the numbers. However, in my quest to find a basis for comparison, I have created the table below. The numbers are from statista.com, globalpetrolprices.com, nordpoolgroup.com and other exchanges.
Price table:
| Country | Fully loaded Average Cost last 12months | Power pricing Spot without tax, levy, investment coverage etc |
| Norway | € 0.03 per kWh | € 0.022 per kWh |
| Sweden | € 0.05 per kWh | € 0.024 per kWh |
| Germany | € 0.22 per kWh | € 0.029 per kWh |
| United Kingdom | € 0.21 per kWh | € 0.033 per kWh |
| Netherlands | € 0.13 per kWh | € 0.031 per kWh |
| France | € 0.13 per kWh | € 0.030 per kWh |
Firstly, I will be the first to admit that this table is not without flaws as well. Sometimes I have heard prices as low as €0.17 in the UK, €0.18 in Germany €0.08 in the Netherlands, but they are all unconfirmed. Secondly, I am sure that there are also countries or local power companies where you can negotiate lower prices. However, after Norway reduced their electricity tax with 97 % in 2018, I have yet to find a country to match the Norwegian level of €0.03.
What does this mean for your data center power bill?
If you are buying data center services, the power bill you receive, may not just be a pure power bill. Many providers are bundling power charges and other costs together, which makes it hard to identify the true cost of power. In other words, with less transparency it is harder to compare.
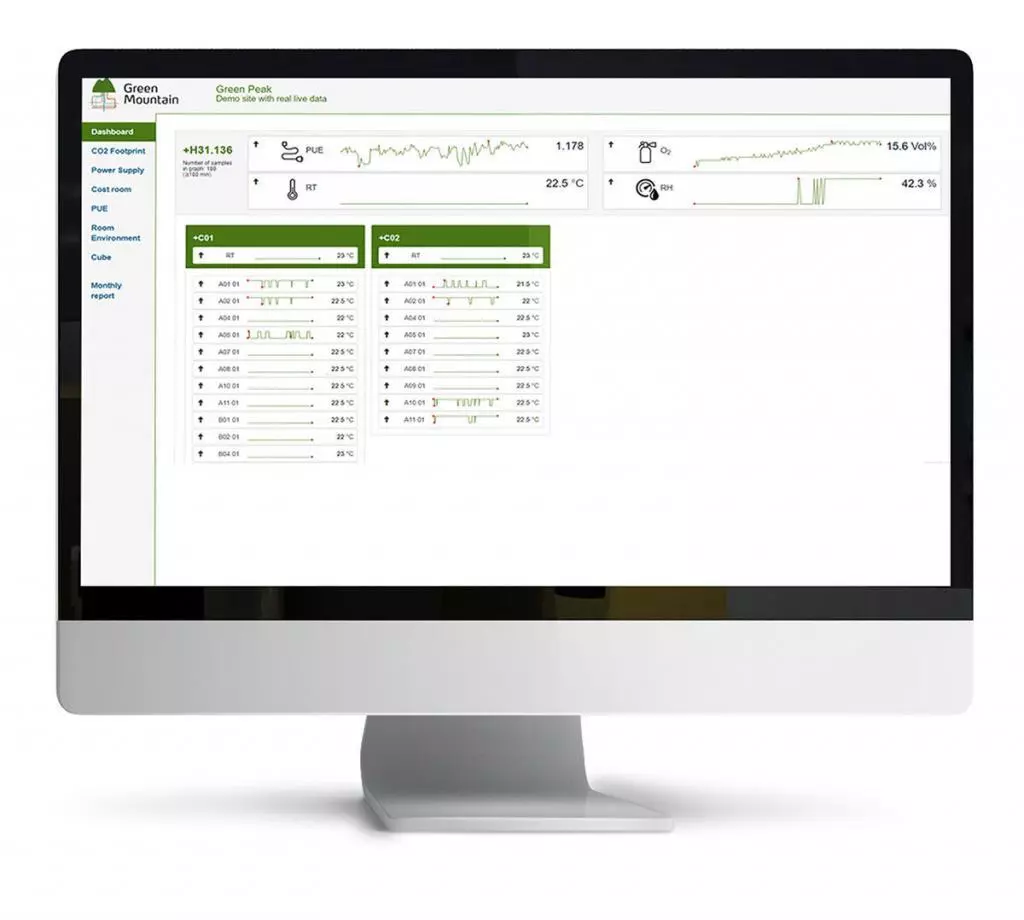
In Green Mountain, we believe that transparency is key in everything we do. Therefore, we made a solution giving our clients full insights into the deliverables. This award-winning solution is called Green Peak. The solution enables live monitoring of clients’ consumption – all the way down to their specific data room, their containment and their individual rack.
The way we calculate data center power costs is easy and transparent. Therefore, I will use our calculation method in the example below:
Example:
- Actual consumption – the power you consume (not the enabled capacity as many providers use)
- The hours in a month – 730 as an average
- Actual PUE – for ease of comparison I am going to use 1.15, which is what our clients have. (Although this is a highly varying number across different providers.)
- Cost of power – see the table
For a 1 MW site, where you have 60 % utilization of available capacity, the calculation looks like this:
- 600kW (actual consumption) x 730 (hrs) x 1.15 (PUE) x €0.3 (Full Cost of Power) = € 15 111 a month
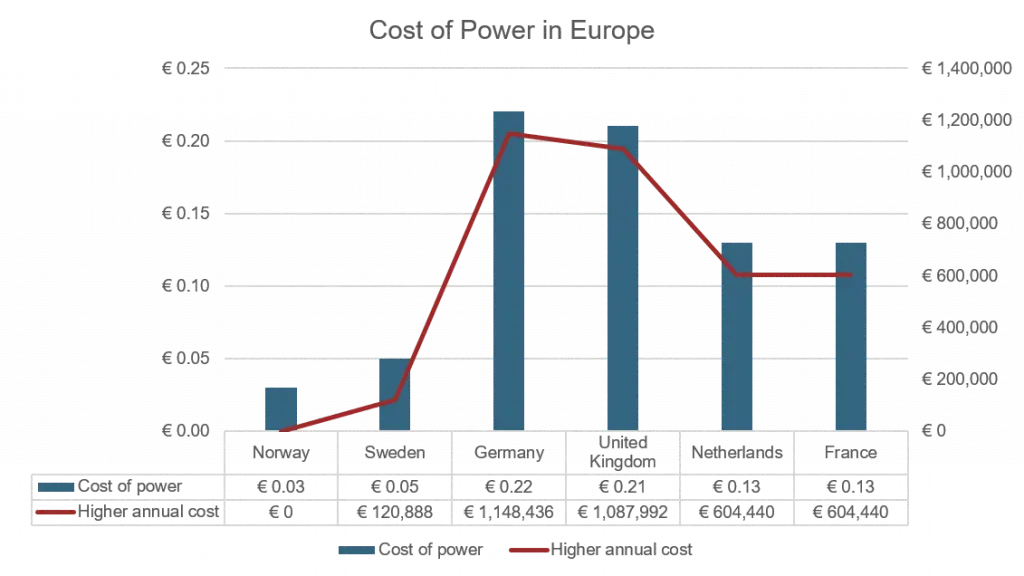
The table below shows the results of this calculation for the different countries:
| Country | Fully loaded Average Cost last 12months | Cost per month | Cost difference annually |
| Norway | € 0.03 per kWh | € 15 111 | |
| Sweden | € 0.05 per kWh | € 25 185 | + € 120 888 |
| Germany | € 0.22 per kWh | € 110 814 | + € 1 148 436 |
| United Kingdom | € 0.21 per kWh | € 105 777 | + € 1 087 992 |
| Netherlands | € 0.13 per kWh | € 65 481 | + € 604 440 |
| France | € 0.13 per kWh | € 65 481 | + € 604 440 |
As illustrated above, you can save up to € 1 148 436 annually on power alone for the duration of the contract. In this case by choosing Norway instead of Germany or UK which are the two largest data center hubs in Europe. That is serious money, especially if you for other reasons do not need to locate in FLAP-D. Even if you must have a presence in FLAP-D, you might consider moving parts of your data to a more economical beneficial location? In addition, if your datacenter can not promise you an annualized PUE of 1.15 (EU average is currently at 1.7) the business case becomes even better.
I would also like to add that there are other significant differences in Europe. Norway is one of the most beneficial locations in terms of cost of land, tax regime for data center establishment and the level of data center automation. You can read more about this in the Norwegian Data Center Strategy.
How long will it last?
Hopefully, I have now convinced you that in terms of power prices, Norway is a good location for data centers. But for how long will this price difference last? Now that the rest of Europe’s countries are shifting from fossil fuels to renewables, this will surely change the landscape and the pricing dynamics as well?
Green Mountain is committed to setting the green standard in the data center industry and we welcome the green energy shift in Europe as well. It is always difficult to predict the future but there are few signs that our relatively stable price level will change in the years to come. There are several factors that support Norway being the price leader in Europe giving the market long-term predictability.
Factors:
- The European green shift needs investments – As Europe turn off the coal plants and shifts to wind and solar this transition needs funding. Massive investments are needed in new infrastructure, something which Norway (and Iceland) already have made. A Data-Economy article clearly illustrated this challenge when using Ireland’s investment needs as an example. Norway being a mature producer of hydropower with little investment need, the cost difference will still prevail for many years to come.
- Overproduction and tax reliefs in Norway – we have around 20 % overproduction of power compared to our own consumption. Therefore, we have exported our excess power to the international market, meaning that through interconnectors to continental Europe we have sent that power to these markets. Which is good, and helps these countries become greener as Norway has 99 % renewable power generation. On the other hand, the disadvantage is that power is lost in transportation. (Approximately 20 % power loss on the way to Germany.) To overcome this the Norwegian Government incentivizes consumption closer to the source, like data centers and other large power consumers. The Norwegian Government was actually the first country in the world to create a data center strategy to attract foreign companies to establish a data center location in Norway. These tax cuts and subsidies are long-term and a competitive price advantage for the Norwegian industry.
- Norway as the battery of Europe – the flexibility of the Norwegian hydropower system can be used for large-scale balancing and energy storage. As opposed to wind and solar where the production varies according to weather, the water reservoirs of Norway can store and balance energy. Moreover, in Europe large amounts of flexibility may be needed to replace electricity generation that is not profitable to invest in. Consequently, this gives us a benefit in both balancing the European power system, but we can also be flexible and withhold hydropower when other power sources, like wind, are cheaper.
- Increase in energy consumption balanced by energy efficiency – Most reports expect an increase in power consumption in Europe which could affect the price level. However, both new technology and government incentives enable significant power-efficiency gains that will balance the increased demand and price level.
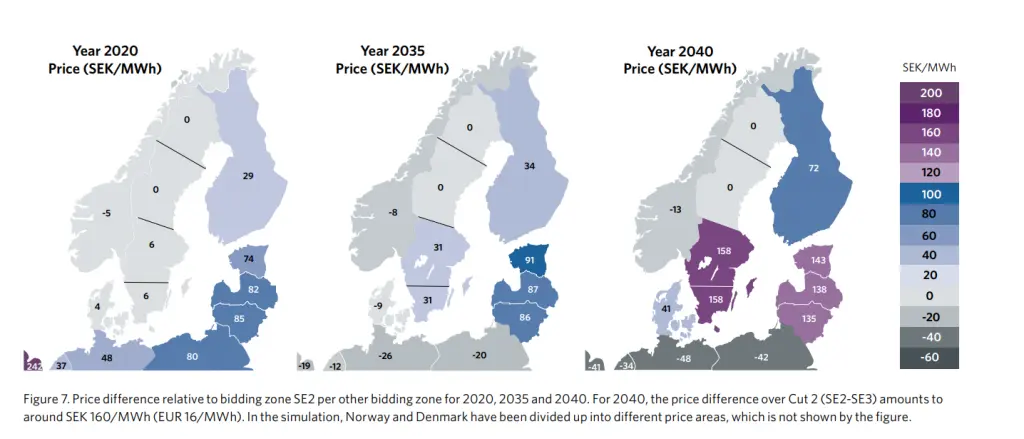
Svenska Kraftnät, the authority responsible for Sweden’s transmission system, recently published a report with a scenario analysis towards 2040. The map below illustrates how they expect the Nordic price differences will be in 2035 and 2040. Certainly, Norway keeps its position as the power price leader in this report.
Strong Norwegian Value Proposition
Of course, you don’t choose a colocation provider or a site for our data center purely based on power savings. We get that. But if you add 100% renewable energy, stable political society, several new connectivity projects and a highly competent workforce into the mix, the Norwegian value proposition looks strong. If you want to know more about these topics feel free to contact me or check out our website. Or if you only have 26 minutes to spare, I recommend this webinar we recorded together with Statkraft and Innovation Norway. Happy watching!