Green Mountain has created a data center CO2 calculator to identify how much you can save in CO2 emissions by moving your data load to Norway. The calulcator is based on live data from electrictymap.org and shows the difference in CO2 emissions and share of renewable energy used in selected European countries.
Easy to use CO2 calculator
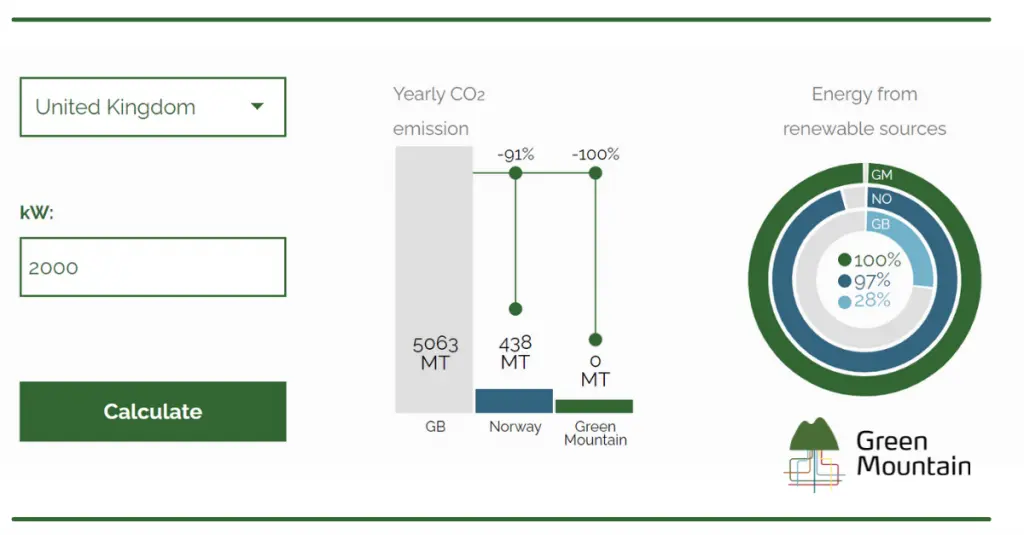
Prospective clients, journalist and others often pose us the same question: How much CO2 can we save by moving our data load to a data center in Norway? And Green Mountain? Well, this of course depends on factors like region, type of data center, capacity and so forth. However, by using the statistics from electrictymap.org you can get a fair indication. To make it even easier, Green Mountain has created a CO2 calculator based on this data from electrictymap.org. You only need to input two variables to get the answer: Data center location and capacity needed in kW. As locations, we have chosen the most frequently used data center hubs in Europe. The so-called FLAP-D countries, as well as one other Nordic country.
Share of renewables and historical data
In addition, the calculator also gives you the share of renewable electricity consumption in the specific country you are comparing with. This is to illustrate that not all low-carbon is renewable. As the calculator is based on live data the estimates will differ slightly during the day. Therefore, we also provide a graph of historical carbon intensity of the traditional data center hubs in Europe.
You can try the new CO2 calculator here. On the same page you will find more info on how the calculators works and some frequently asked questions. If successfull, we will add more countries and functionality to the calculator in the future. So please let us know if this is useful!